ABC: State Construction Unemployment Is Down in 45 States From a Year Ago
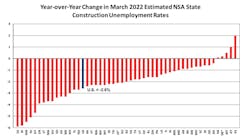
WASHINGTON, DC — The not seasonally adjusted national construction unemployment rate dropped 2.6% in March 2022 from a year ago, down from 8.6% to 6%, while 45 states had lower unemployment rates over the same period, according to a state-by-state analysis of U.S. Bureau of Labor Statistics data released today by Associated Builders and Contractors. This considerable improvement occurred as cases of the omicron variant fell and many states began lifting some or all of their COVID-19 restrictions.
National NSA construction employment was 230,000 higher than in March 2021. For the first time since the pandemic hit the United States, seasonally adjusted construction employment in March 2022 edged above its pre-pandemic peak in February 2020 (up 4,000). That’s even as national seasonally adjusted nonfarm payroll employment, despite continuing to improve, was 1% below its February 2020 peak.
Residential construction employment rebounded more strongly than nonresidential construction employment. March SA residential construction employment was 83,000 above its pre-pandemic peak while nonresidential construction employment was 79,000 below its pre-pandemic peak, for a net gain of 4,000 in construction employment.
The national NSA construction unemployment rate of 6% was up 0.8 in March 2022 from its March 2019 reading. Over that same period, 23 states had lower construction unemployment rates, 26 states had higher rates and one (Oklahoma) was unchanged.
“The construction industry has shown remarkable resiliency in the face of many pandemic-related obstacles. Now, the industry faces rising interest rates and further supply chain disruptions due to the Russia-Ukraine war,” said Bernard Markstein, president and chief economist of Markstein Advisors, who conducted the analysis for ABC. “Nonetheless, the near-term outlook for construction activity and employment remains positive. Both builders and developers have shown remarkable agility in coping with the numerous challenges over the past two years.”
Recent Month-to-Month Fluctuations
National and state unemployment rates are best evaluated on a year-over-year basis because these industry-specific rates are not seasonally adjusted. However, due to the changing impact of the COVID-19 pandemic and related shifts in public policy, month-to-month comparisons offer a better understanding of the pandemic’s effect on construction employment in a rapidly changing economic environment, though care must be used in drawing conclusions from these numbers.
Since the data series began in 2000, national NSA construction unemployment rates have generally fallen from February to March, with 18 decreases, three increases and one year (2016) with no change. March 2022 posted another decline, down 0.7% from February. Thirty-eight states had lower estimated construction unemployment rates than in February, 11 states had higher rates and one (Montana) had the same rate.
The Top Five States
The five states with the lowest March 2022 estimated NSA construction unemployment rates were:
- South Dakota, 1.3%
- Nebraska, 1.8%
- Utah, 2%
- Arizona, 2.8%
- Georgia and Idaho (tie), 3.2%
Arizona, Georgia, South Dakota and Utah each posted their lowest March estimated NSA construction unemployment rate on record. Meanwhile, Idaho and Nebraska turned in their second lowest March rates on record. Both were only 0.1% above their lowest rate.
The Bottom Five States
The states with the highest March 2022 estimated NSA construction unemployment rates were:
- New Jersey, 8.9%
- Michigan, 9.3%
- Illinois, 9.8%
- West Virginia, 9.9%
- New York, 10.3%
New Jersey and New York had the fourth and fifth largest year-over-year decrease, respectively, among the states.
Click here to view graphs of overall unemployment rates and construction unemployment rates showing the impact of the pandemic, including a graphing tool that creates a chart for multiple states.
To better understand the basis for calculating unemployment rates and what they measure, check out the Background on State Construction Unemployment Rates.
Visit abc.org/economics for the Construction Backlog Indicator and Construction Confidence Index, plus analysis of spending, employment, GDP and the Producer Price Index.

